This module allows to load a line graph per ordered pair from an One2many or
Many2many field.
Use this widget by including:
<field name="field_text_json" widget="json_graph" />
For example:
<field name="values_data" widget="json_graph"/>
The JSON needs to be like:
fields = ['field1', 'field2', 'field3', ...]
field_x = 'field_x'
dictionary = self.value_ids.sorted(field_x).read(fields)
color = {
    'field1': HEXCOLOR1,
    'field2': '#FFBB78',
    'field3': '#1F77B4',
    ...
}
dictionary = self.value_ids.sorted(field_x).read(fields)
content = {}
data = []
for field in fields:
    if field != field_x:
        content[field] = []
        for rec in dictionary:
            content[field].append({'x': rec[field_x], 'y': rec[field]})
        if field in color:
            data.append({'values': content[field], 'key': field,
                'color': color[field]})
            continue
        data.append({'values': content[field], 'key': field})
info = {
    'label_x': 'X Label',
    'label_y': 'Y label',
    'data': data
}
self.field_text_json = json.dumps(info)
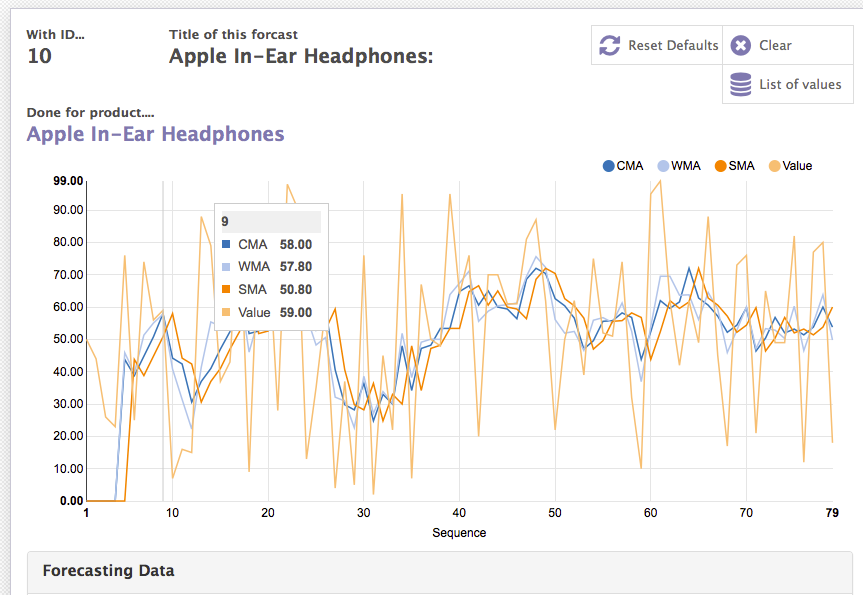
For example:
fields = ['sequence', 'value', 'sma', 'cma']
field_x = 'sequence'
dictionary = self.value_ids.sorted(field_x).read(fields)
color = {
    'value': '#2CA02C',
    'sma': '#FFBB78'
}
dictionary = self.value_ids.sorted(field_x).read(fields)
content = {}
data = []
for field in fields:
    if field != field_x:
        content[field] = []
        for rec in dictionary:
            content[field].append({'x': rec[field_x], 'y': rec[field]})
        if field in color:
            data.append({'values': content[field], 'key': field,
                'color': color[field]})
            continue
        data.append({'values': content[field], 'key': field})
info = {
    'label_x': 'Sequence',
    'label_y': '',
    'data': data
}
self.values_data = json.dumps(info)
Bugs are tracked on GitHub Issues.
In case of trouble, please check there if your issue has already been reported.
If you spotted it first, help us smashing it by providing a detailed and welcomed
feedback.
Do not contact contributors directly about support or help with technical issues.